What is GMap?
GMap is an algorithm for visualizing graphs as maps. Information visualization can be invaluable in making sense out of large data sets. However, traditional graph visualization methods often fail to capture the underlying structural information, clustering, and neighborhoods. GMap, provides a way to overcome some of the shortcomings with the help of the geographic map metaphor. While graphs, charts, and tables often require considerable effort to comprehend, a map representation is more intuitive, as most people are very familiar with maps and even enjoy carefully examining maps. The effectiveness of GMap is illustrated with examples from several domains, namely TV shows, Amazon books, and last.fm music.
Examples


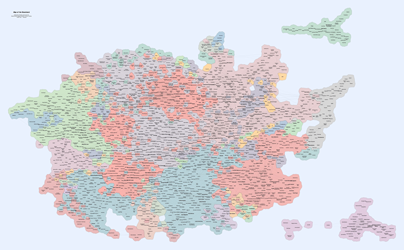
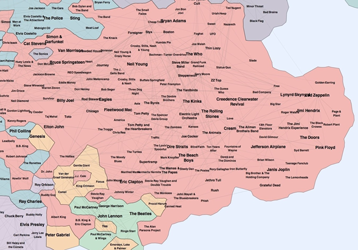
This map of music shows relations between musicians/groups. Related musicians are closeby and in the same country.
See also the list of recently created maps.
Algorithms and Implementation


This map of music shows relations between musicians/groups. Related musicians are closeby and in the same country.
The system relies on a model behind drawing clustered graphs. The GMap framework combines graph layout and graph clustering, together with appropriate coloring of the clusters and creating boundaries based on clusters and connectivity in the original graph. The approach can be generalized to any relational data set. In GMap the visualization is based on a modified Voronoi diagram of the nodes, which in turn is determined by the embedding and clustering. The algorithms are described in a series of research papers:
- Putting Recommendations on the Map - Visualizing Clusters and Relations
- GMap: Visualizing Graphs and Clusters as Maps
- Visualizing Dynamic Data with Maps
- Visualizing Graphs as Maps with Contiguous Regions, a video accompanying the paper with more details
Source code for the entire system is available on Github. A dataset of real-world graphs and networks used for our experiments can be downloaded here.